A simple annual budget template for Google sheets
First published June 06, 2020Tags: [
finances
spreadsheets ]
A template for an annual budget spreadsheet, which tracks one’s spending on a weekly basis.
This budget allows you to input your expected incomes and expenditures for the year ahead, and forecast your balances through the next 12 months. This sheet is especially suited to students, allowing you to know in advance if you’re heading towards your overdraft (or beyond) later in the year.
The template can be found here. This link will lead to a prompt to copy the file, following which the sheet will most likely be available within your ‘My Drive’ folder. The rest of this post will be a brief summary of the functionality available. One will note that there is two different templates – one with investments and one without. These are mostly identical but with some small additions in the former to allow the user to track an investment portfolio as well. This guide will focus on the latter, with an addendum on the former.
1. Overview
First things first, only cells with red font should be editted by the user, and any others left to be automatically filled in. This sheet tracks two balances for the user - a main spending account and a savings account. All spending and income is assumed to be coming in and out of the main account, with the savings account remaining untouched apart from the occasional deposit or withdrawel. The sheet is split vertically into four sections. They are PLANNED, RECORDED, PROJECTED, and MISC.
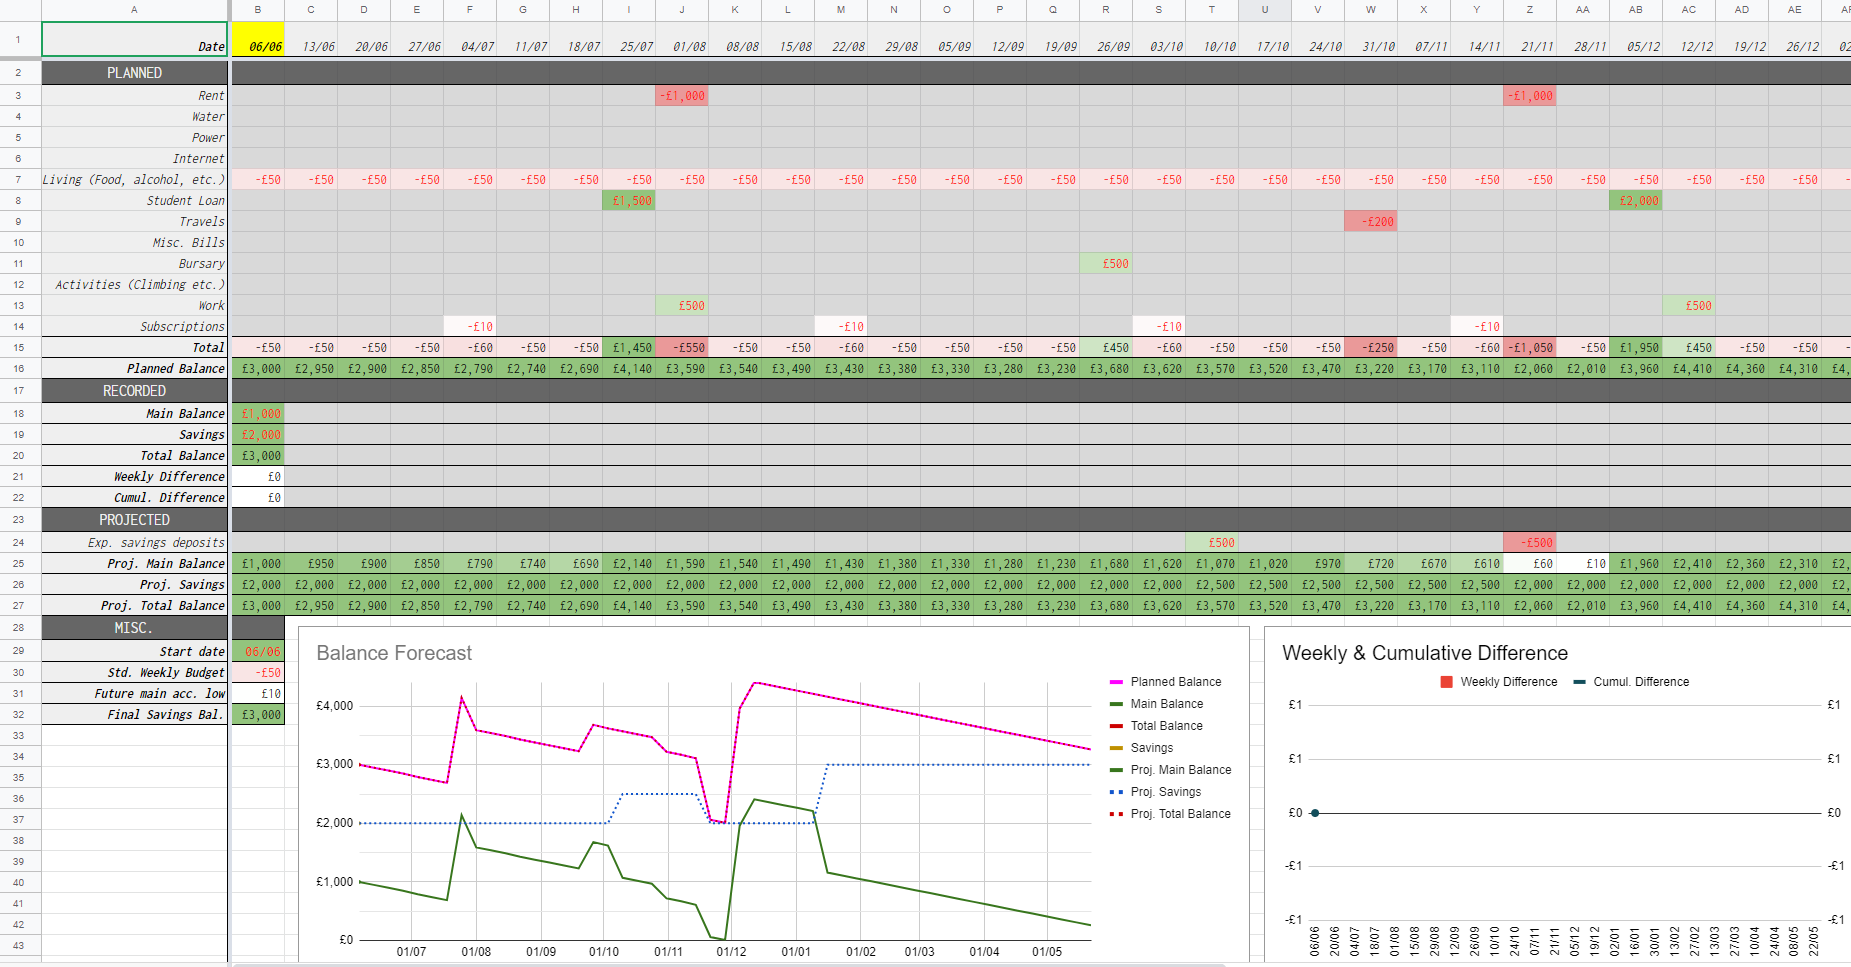
[Click the image for a larger version]
Each column of the sheet represents a week, with the date at the top being the first day of that week. Choose your start date in the bottom-left corner under MISC. and the rest of the year will be filled in. The current week will be highlighted in yellow for visibility. We will now take a more in-depth look at the first three of these sections.
The PLANNED section is where you should input all of your expected incomes and expenditures throughout the year, separated by category. For example, if the user has a student loan coming in on 21/4/2021 of £2000, they should find the week containing 21/4 and enter 2000 in the Student loan row. If Spotify will be charging the user £5 on 11/1/2021, they should enter -5 in the Subscriptions row under the relevent week. One should fill this section in to the best of their knowledge at the start of the budget to make projections/forecasts as accurate as possible, but of course one can edit this section through the year too as their financial situation changes. Note that the Living costs section will be already filled in, containing a default weekly budget which the user can set under the MISC. header. This can of course be overridden if a particular week is expected to be particularly cheap or expensive. Note that rows can be renamed, added, and removed from this section easily to suit the users own needs.
The RECORDED section is where one should record their balances at the end of every week. As mentioned earlier, this sheet is set up to contain two balances – a main spending account and a savings account. The user should input the total balances of these accounts after each week, which will then subsequently be compared to the forecasted balances to see whether you have overspent or underspent that week. For example, if you have reached the end of the week commencing 3/2/2021 with £2030 in your main spending account and £405 in your savings, you should enter these values under 3/2 in the RECORDED section.
Finally the PROJECTED section does not require much input at all. Here data from previous weeks is combined with expected spending taken from PLANNED to predict future balances. There is one row which allows inputs, that being the Exp. savings deposit which allows you to tell the sheet if you are planning to move your own money around in the future. For example, if you know that in the week of 6/12/2020 that you’ll need to take £200 out of your savings to help pay for Christmas, you can enter -200 in this section. Similarly, if you plan to move £500 into your savings in a particular week, you can enter in this row to make sure that is taken account of in any projections.
2. Investments (Optional)
If the user wishes, the sheet can also track their investment portfolio. In principle, this functions the same as having a second savings account being tracked separately, but with a small difference. One can set an expected weekly gain under the MISC. heading. This value is defaulted at 1%, meaning you expect your portfolio to increase in value by 1% every week.
One also has a new Exp. investments section which functions identically to the Exp. savings deposit and allows the user to input whether they expect to move money from their main account into their investments or vice versa.
3. Everything else
There is then nothing else that the user needs to input themselves, and from here the sheet will plot a graph projecting your balances through the rest of the year. Under MISC. the Future main acc. low value simply records how low your main account is projected to hit in the future, and serves as a good indicator as to whether you are able to move some money into savings, or on the other end of the spectrum are heading towards your overdraft (or are simply running out of money). The second graph will fill out through the year, and tracks how over/under budget your spending has been so far.
Everything else within this sheet is hopefully self-explanatory, but if you have any questions about it then feel free to drop me an email or a comment below.